Below you find some examples of data visualization projects that I have worked on.
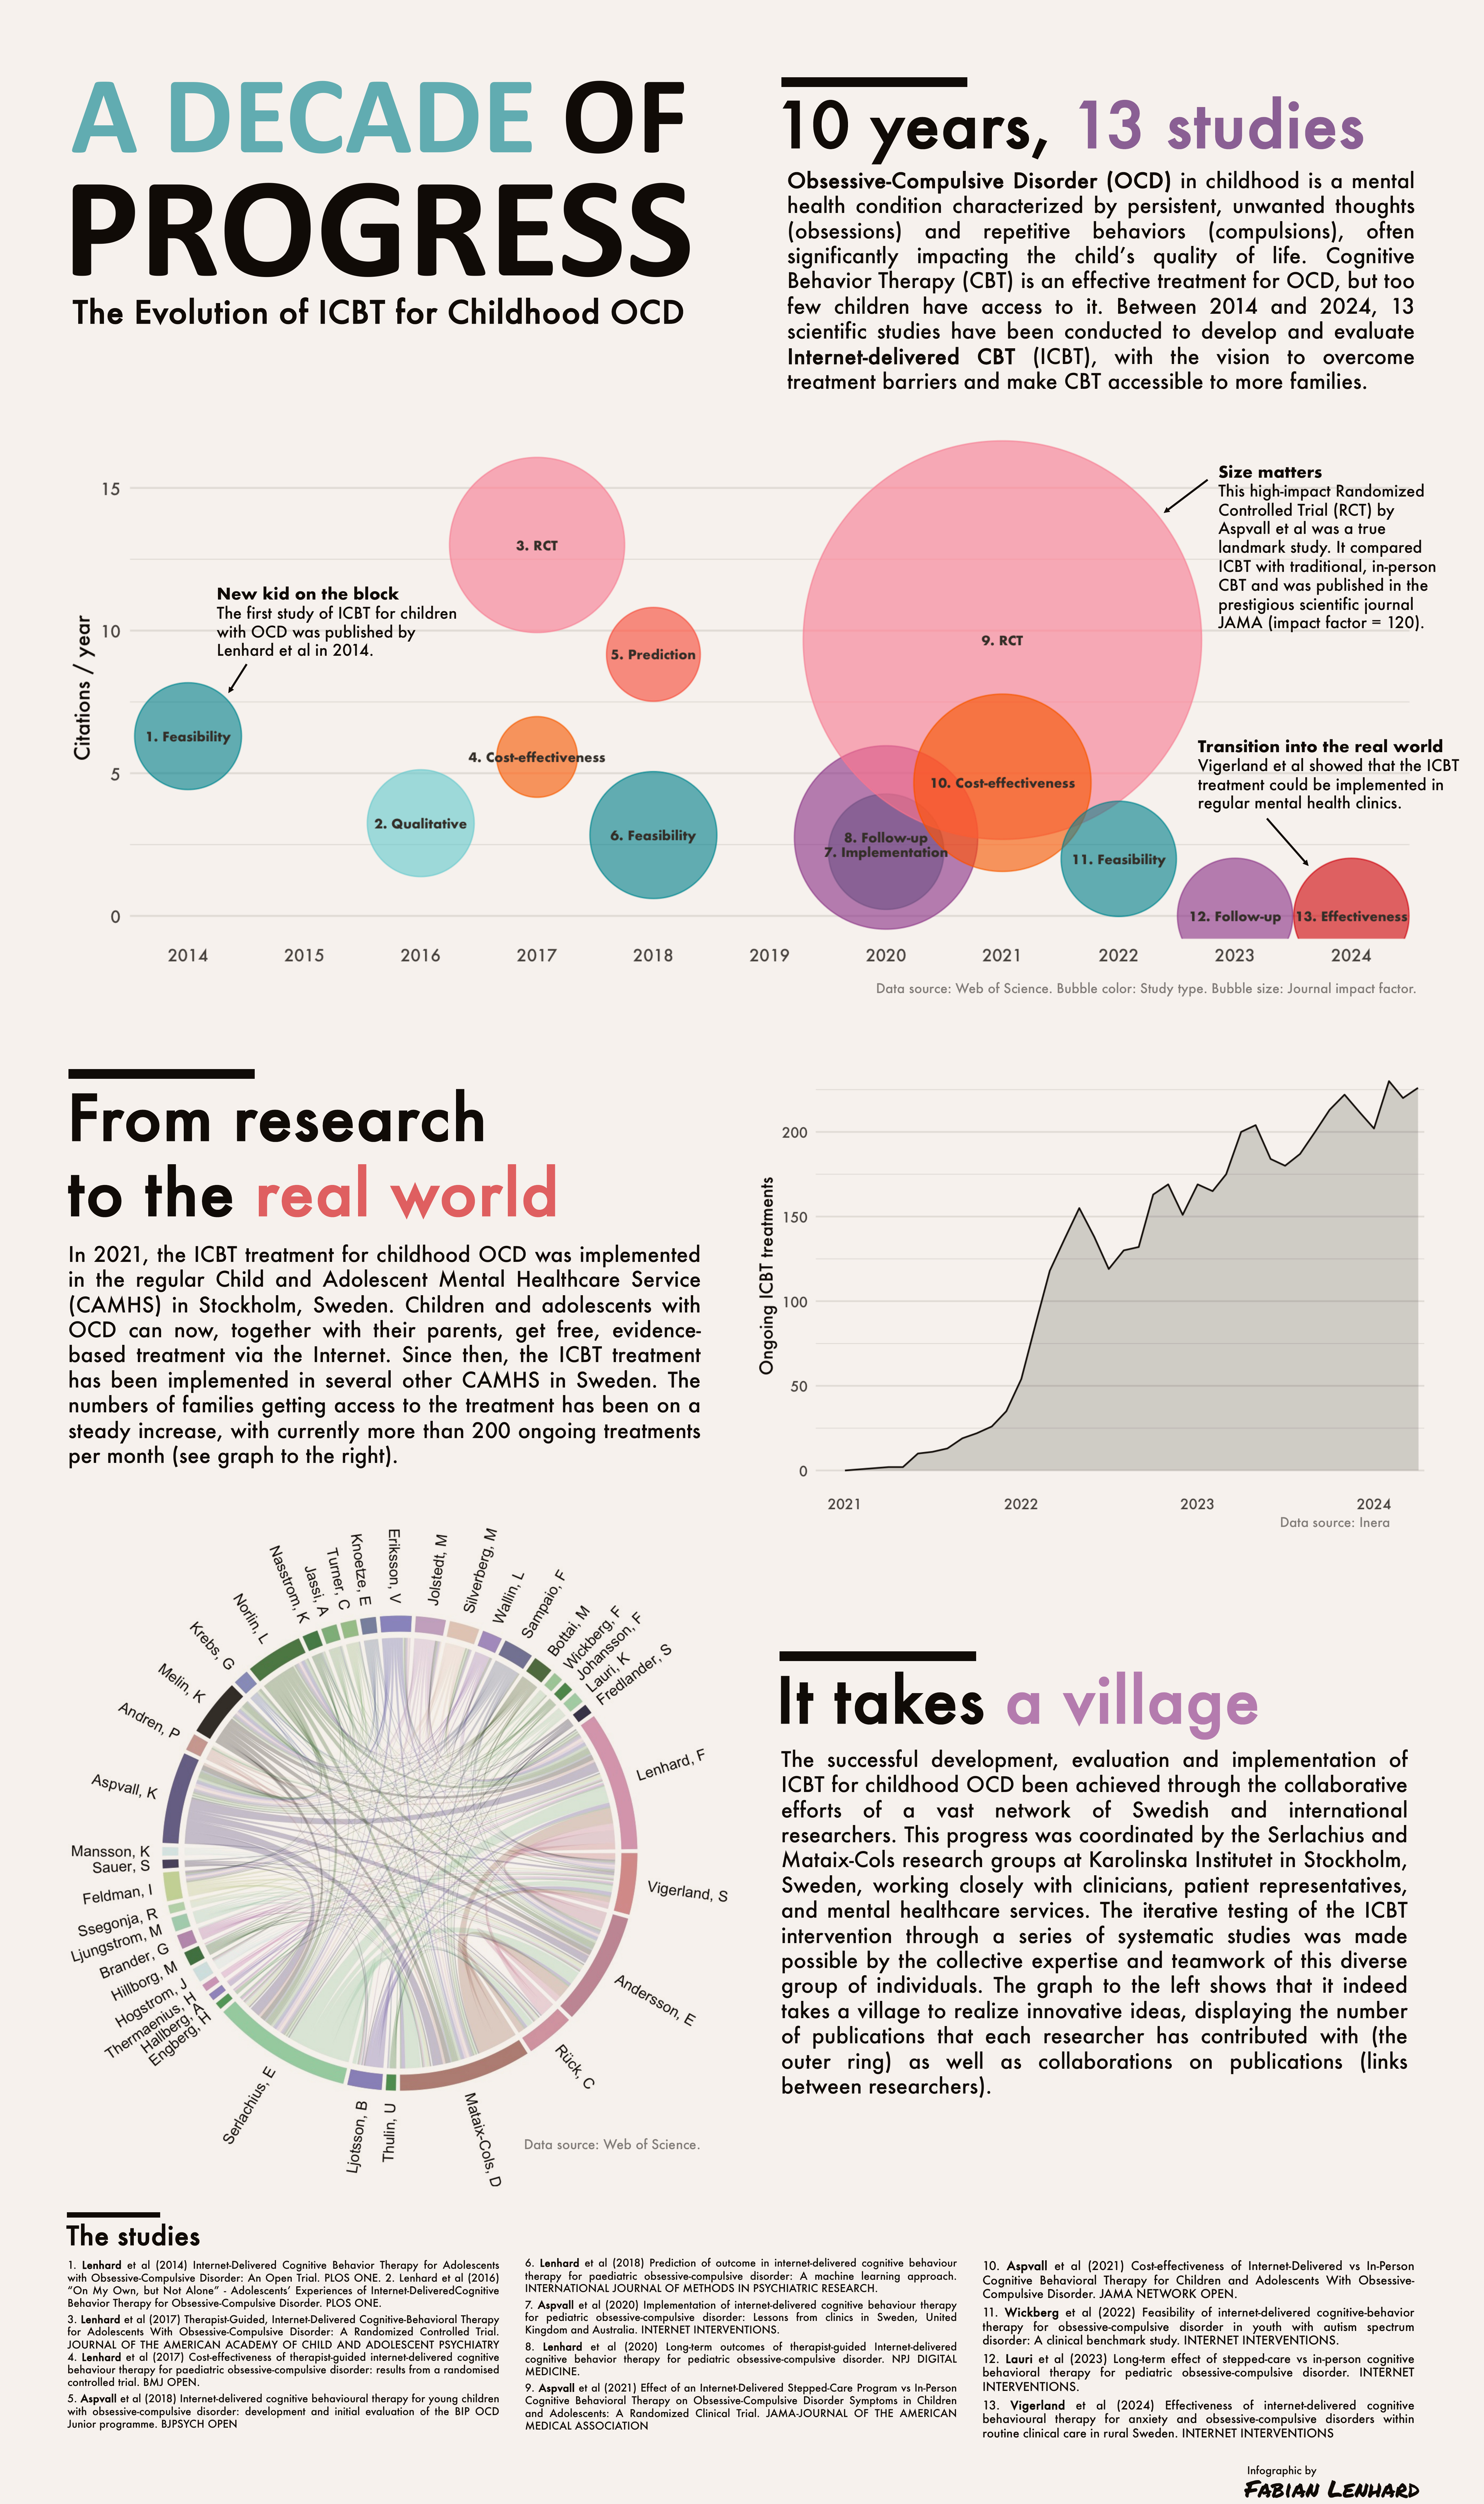
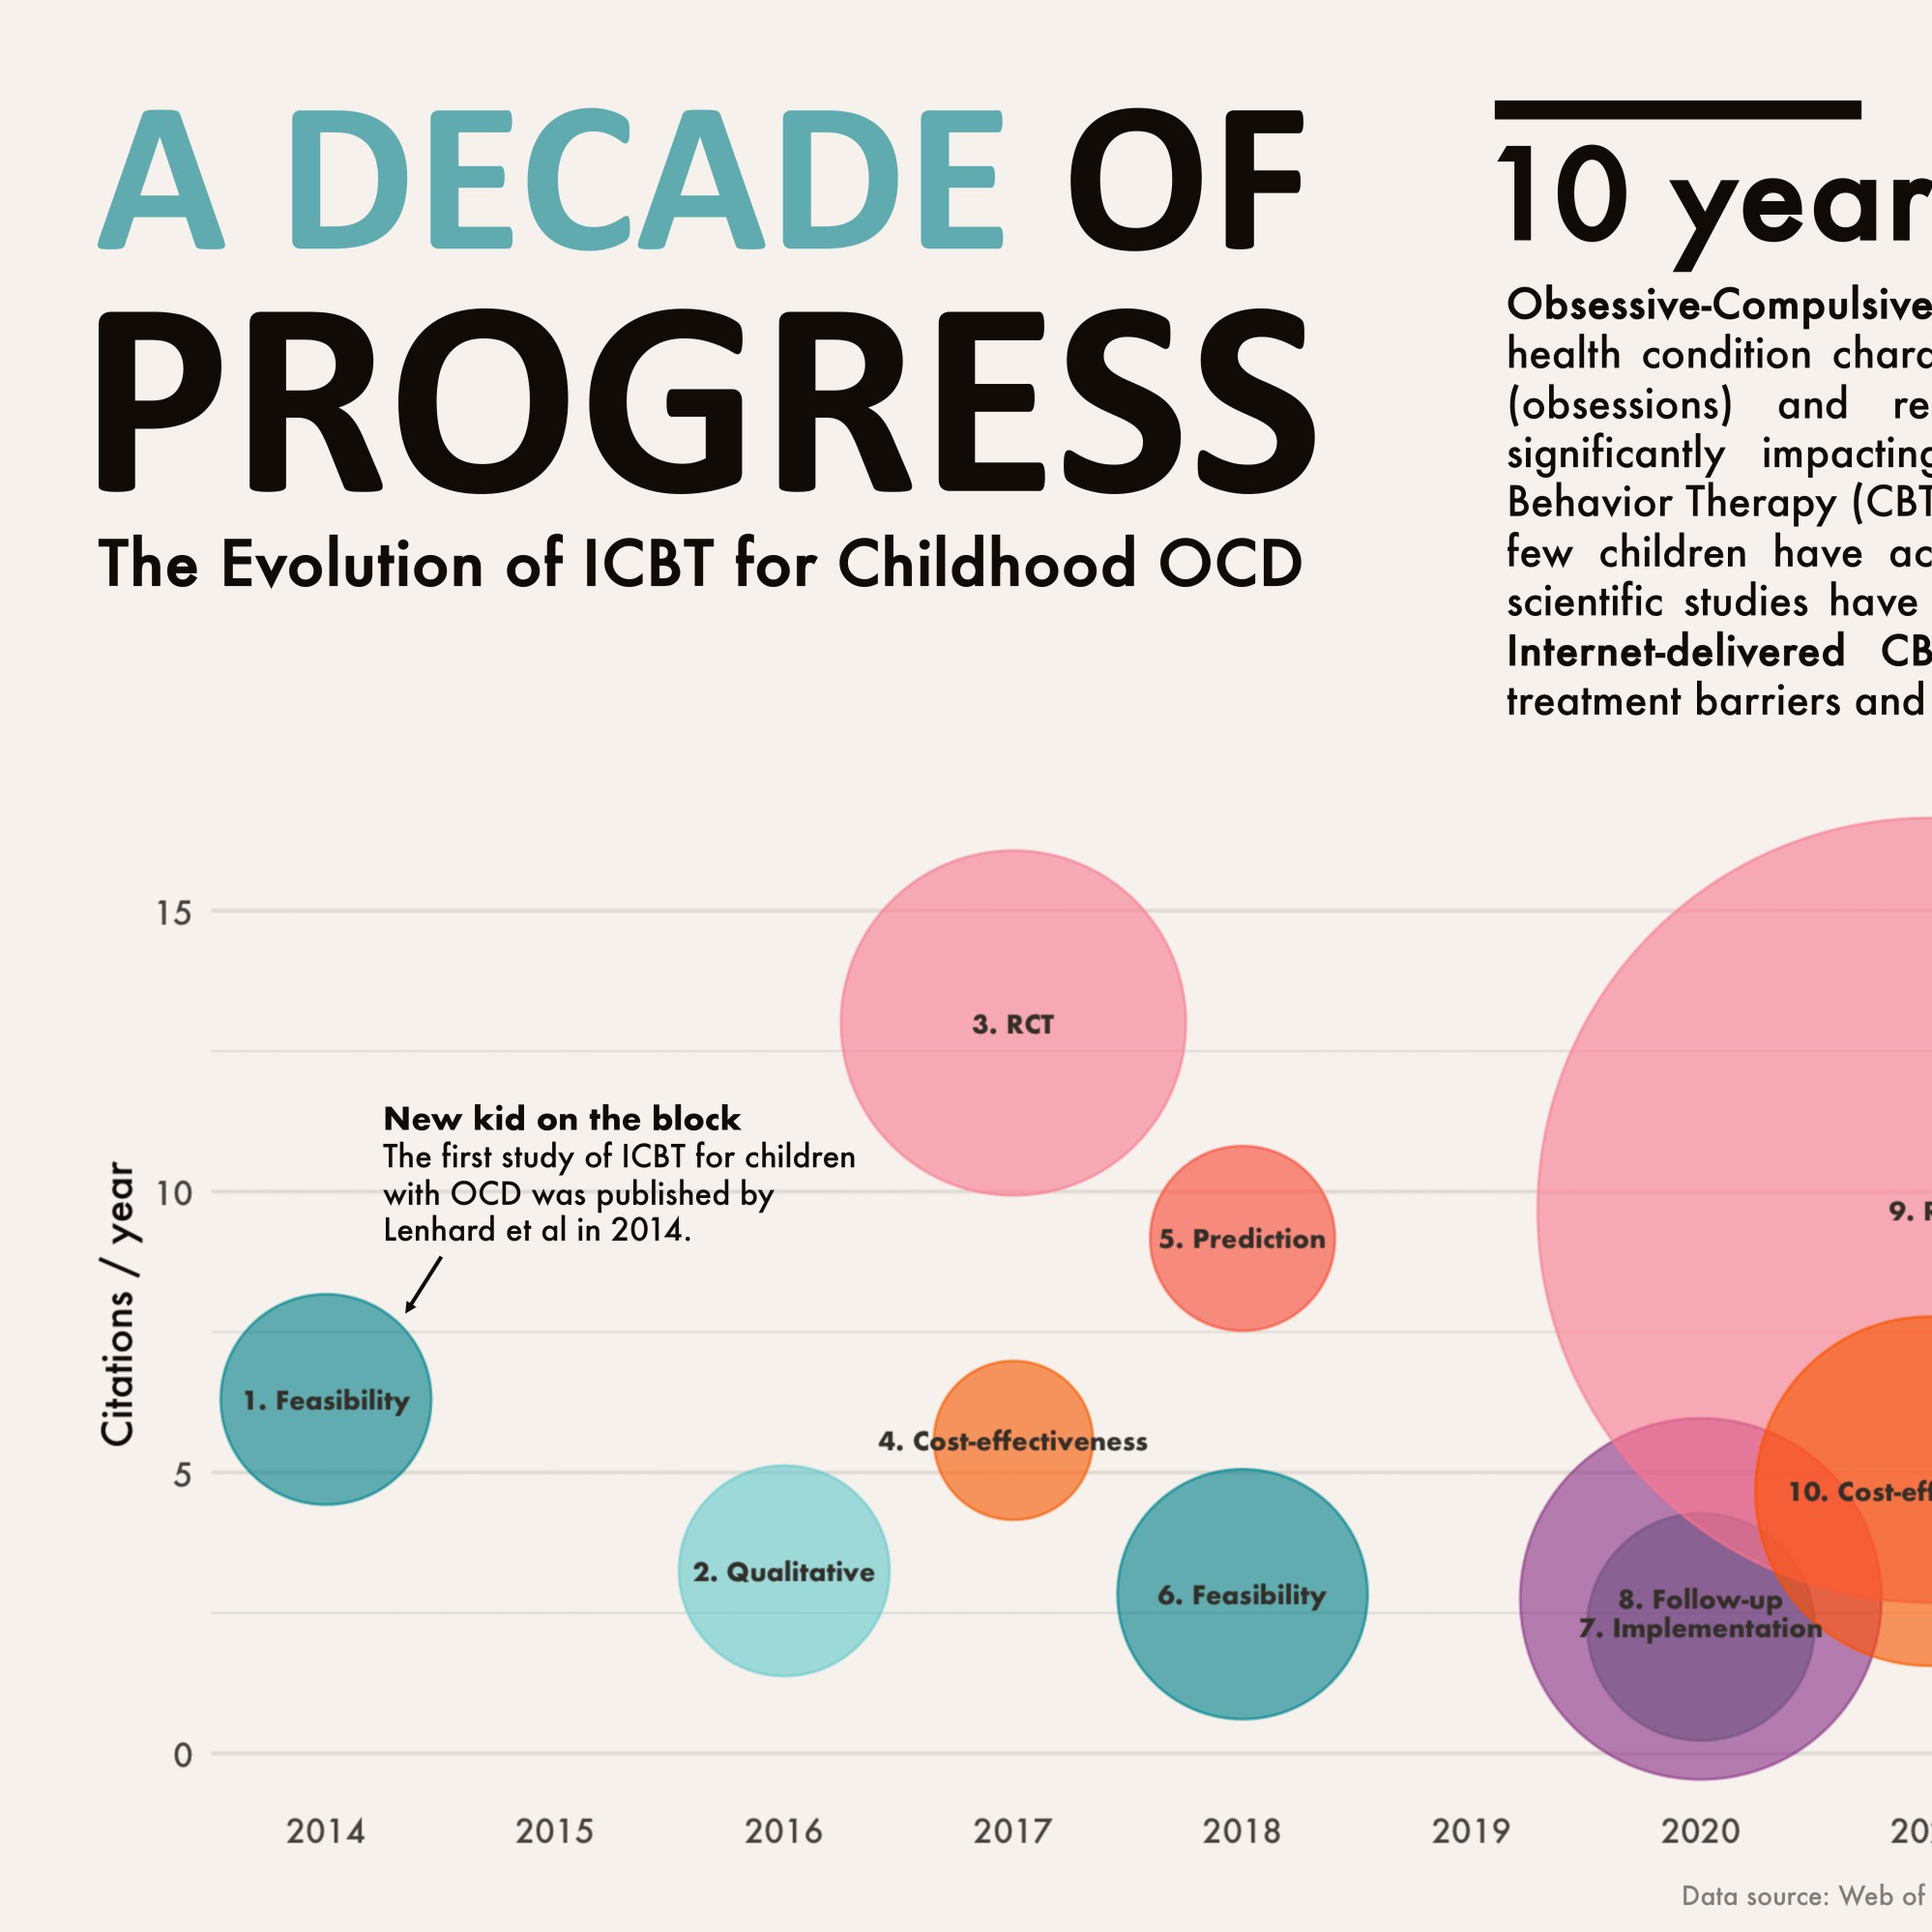
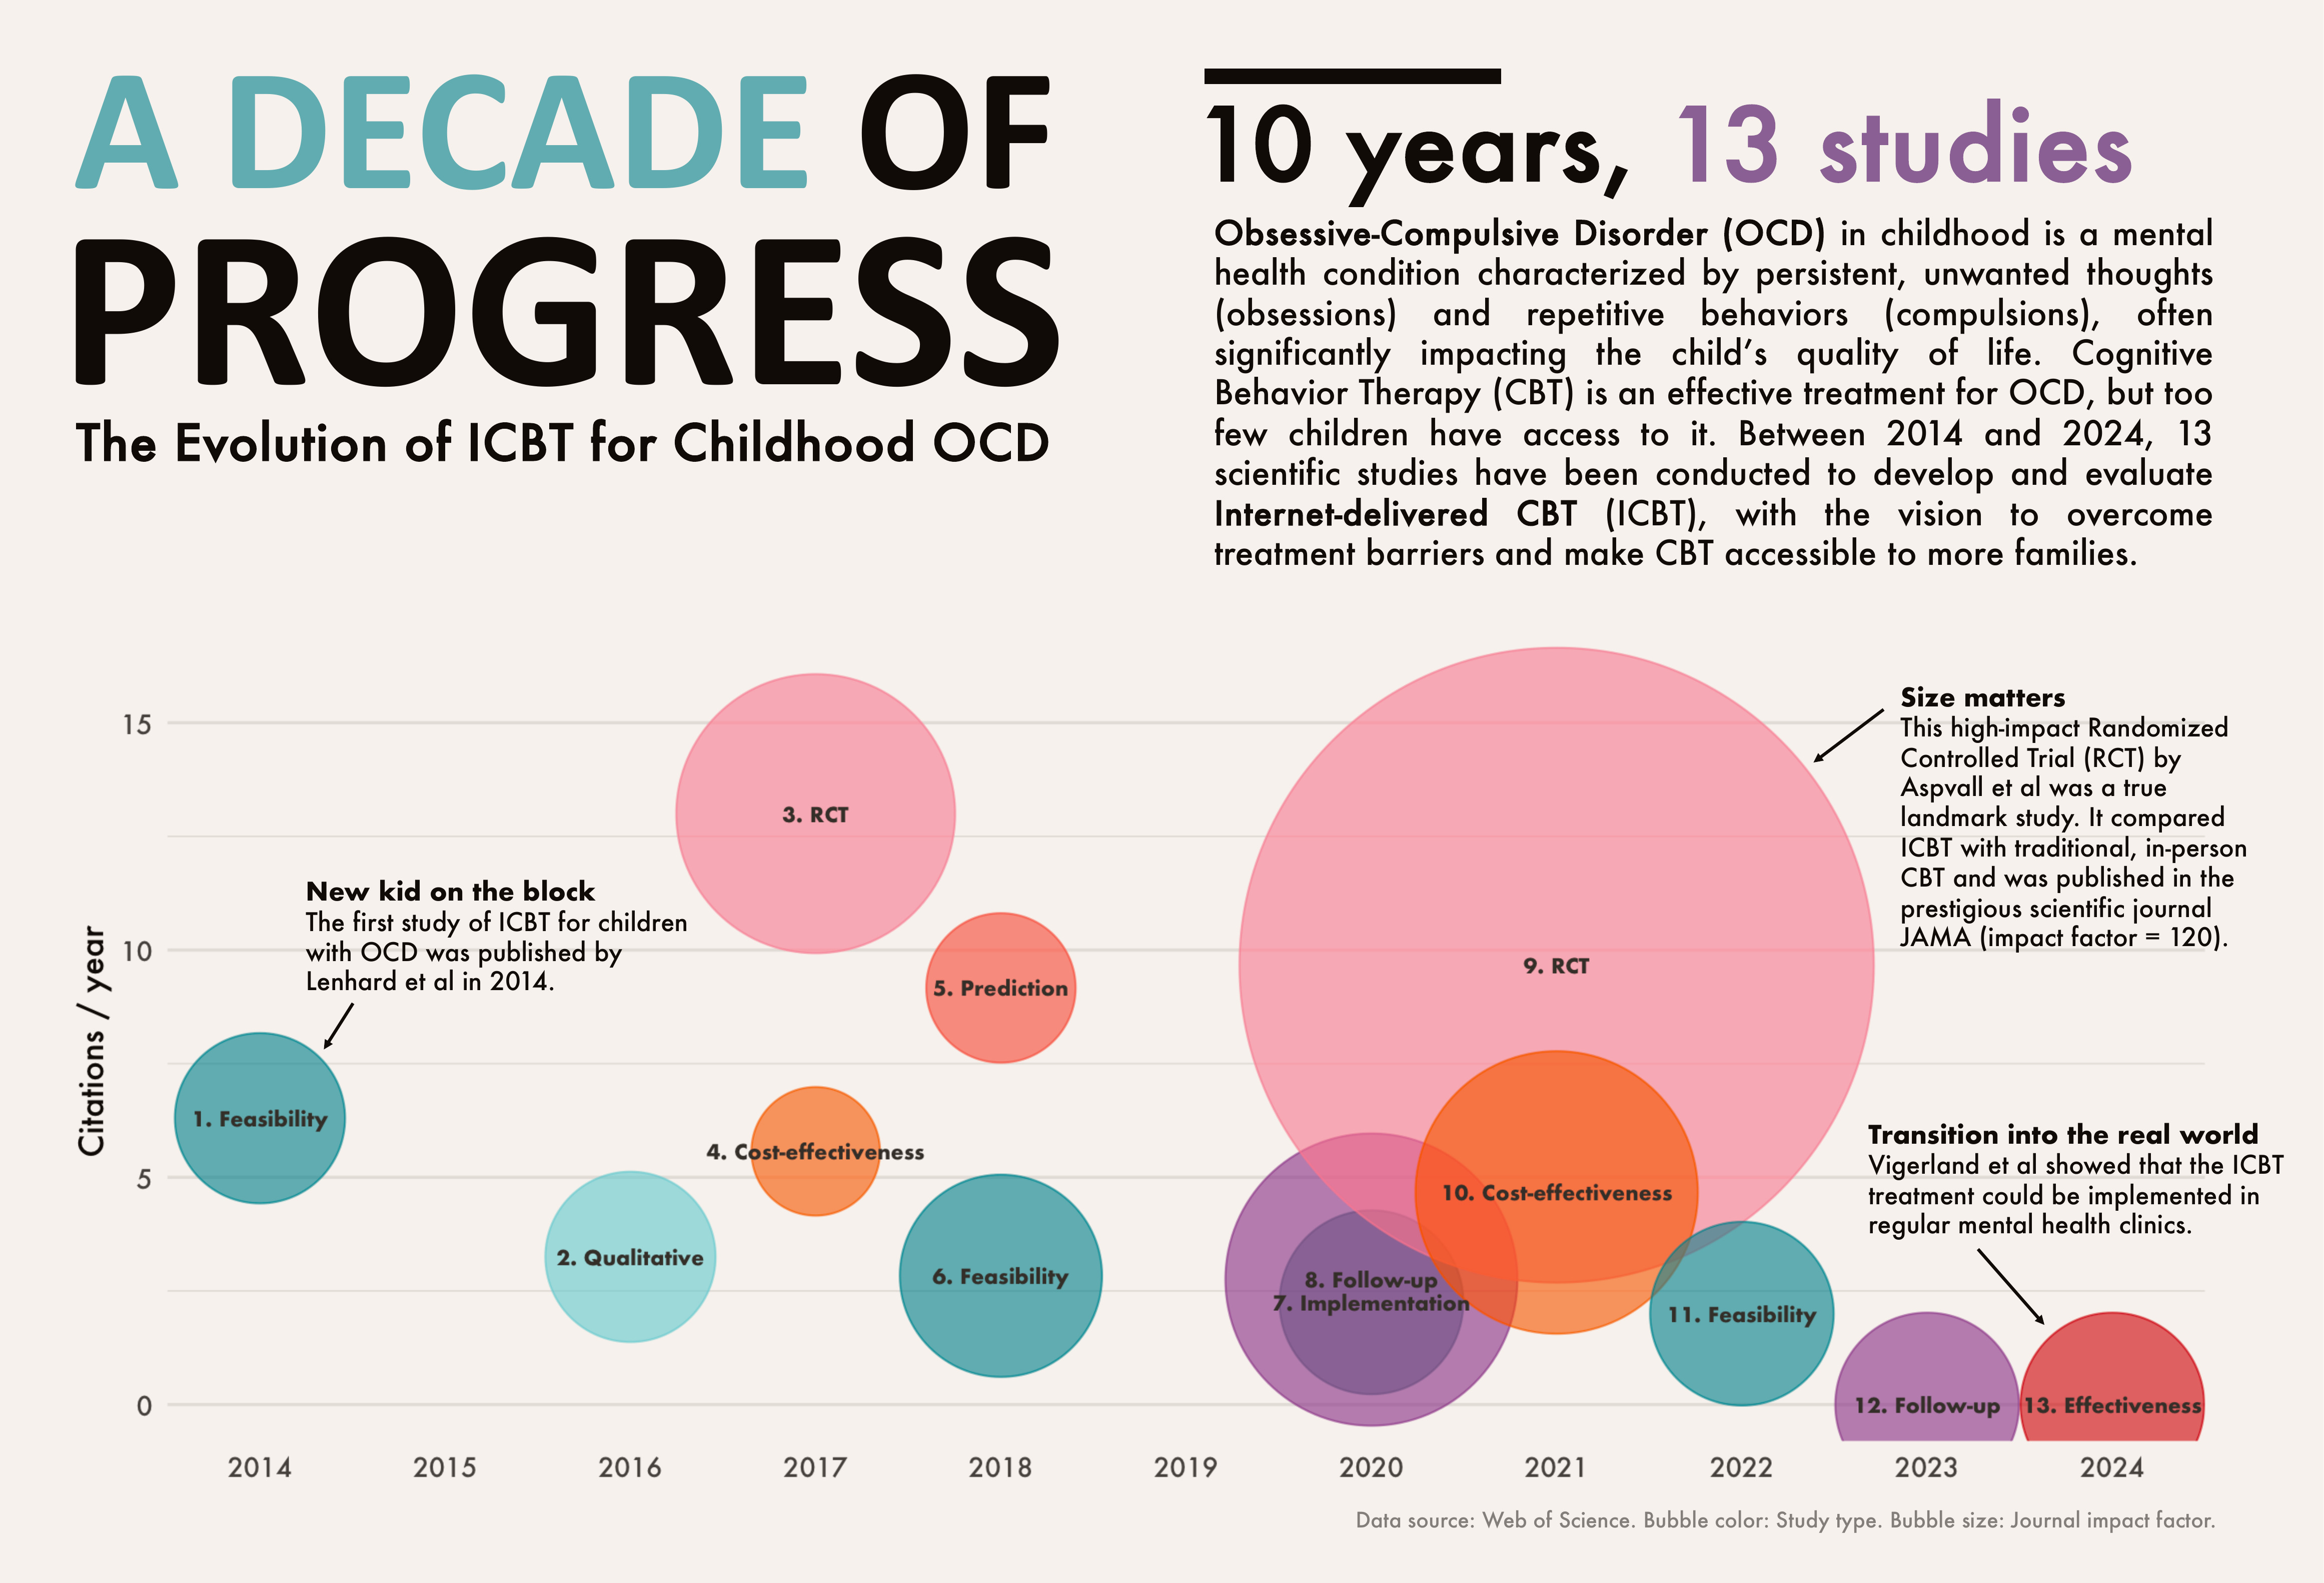
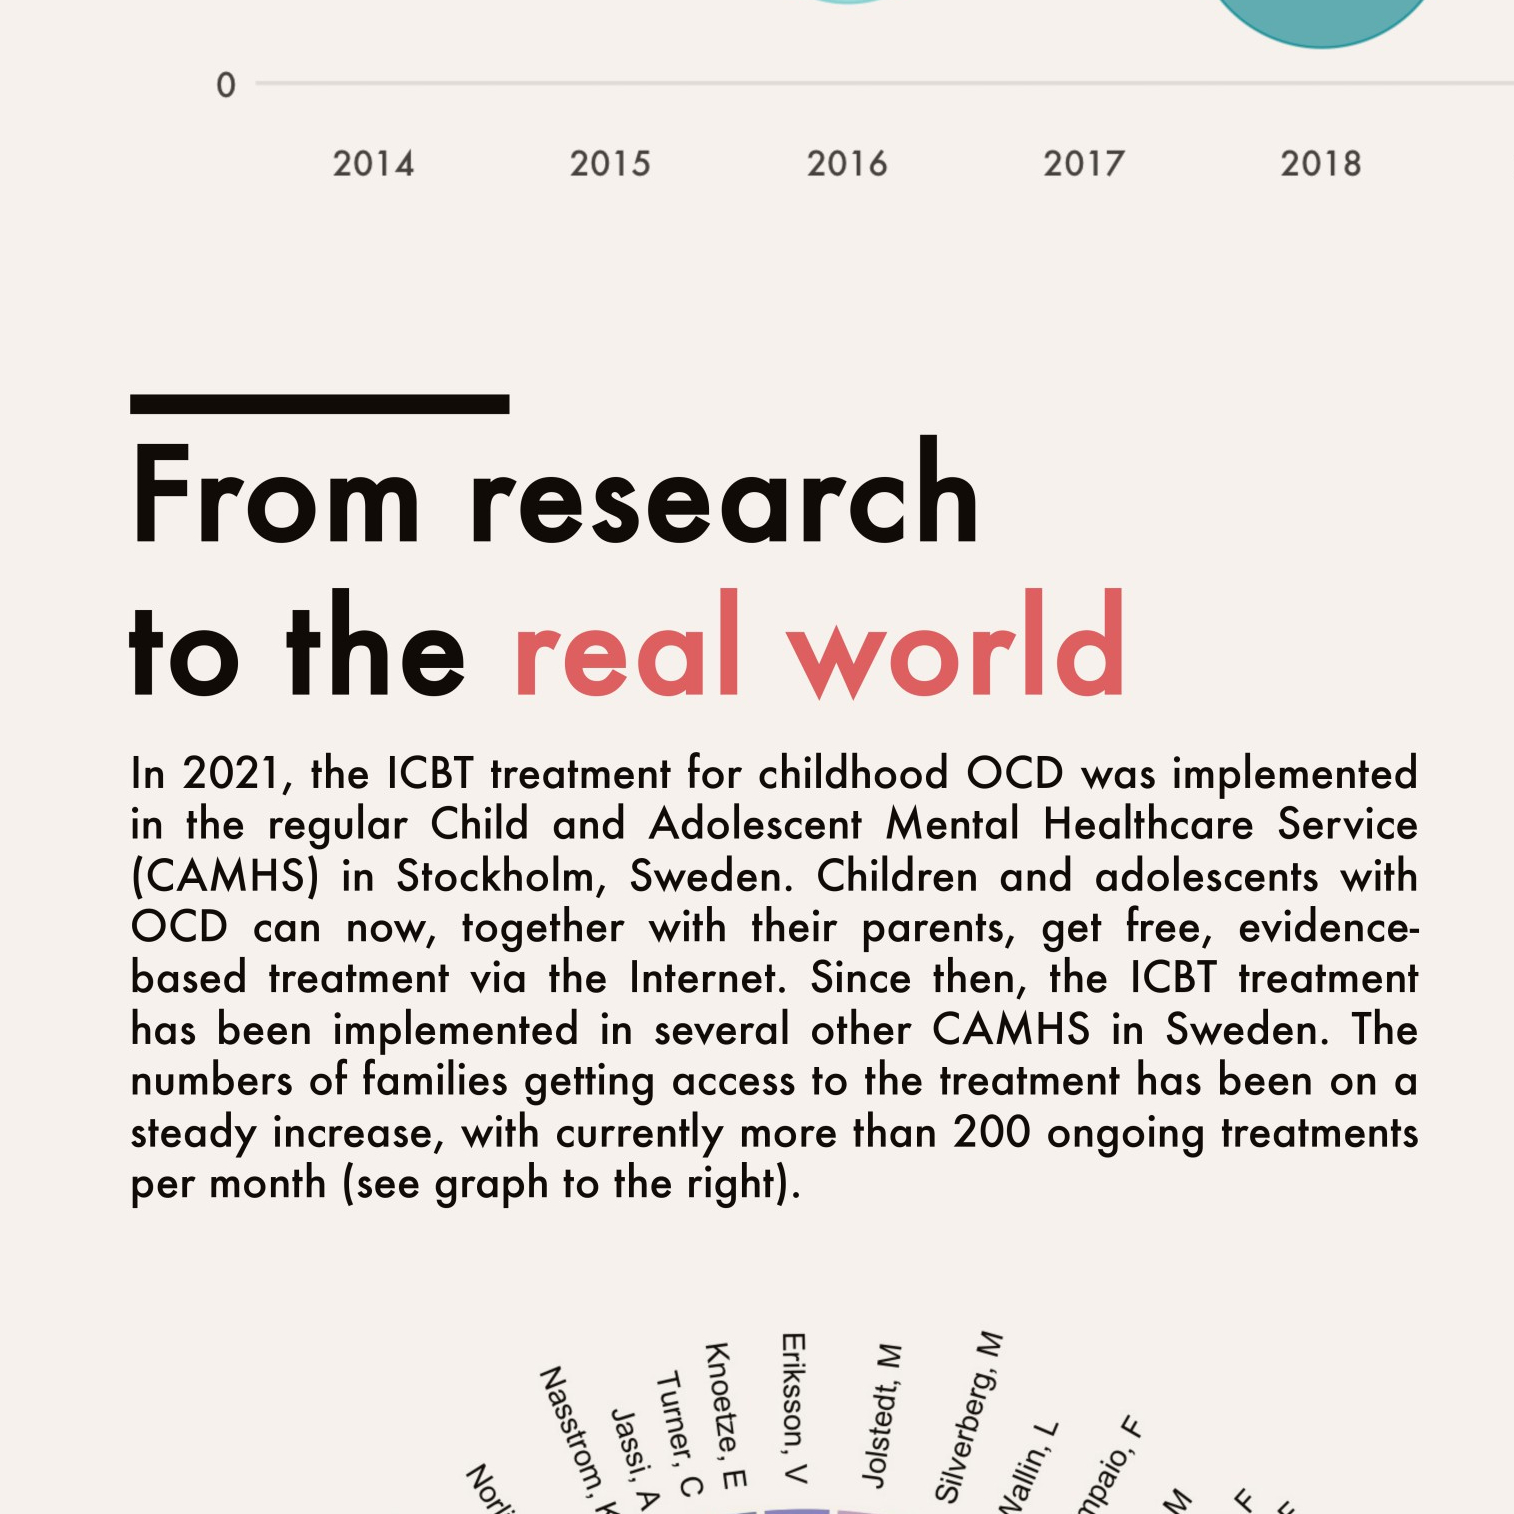
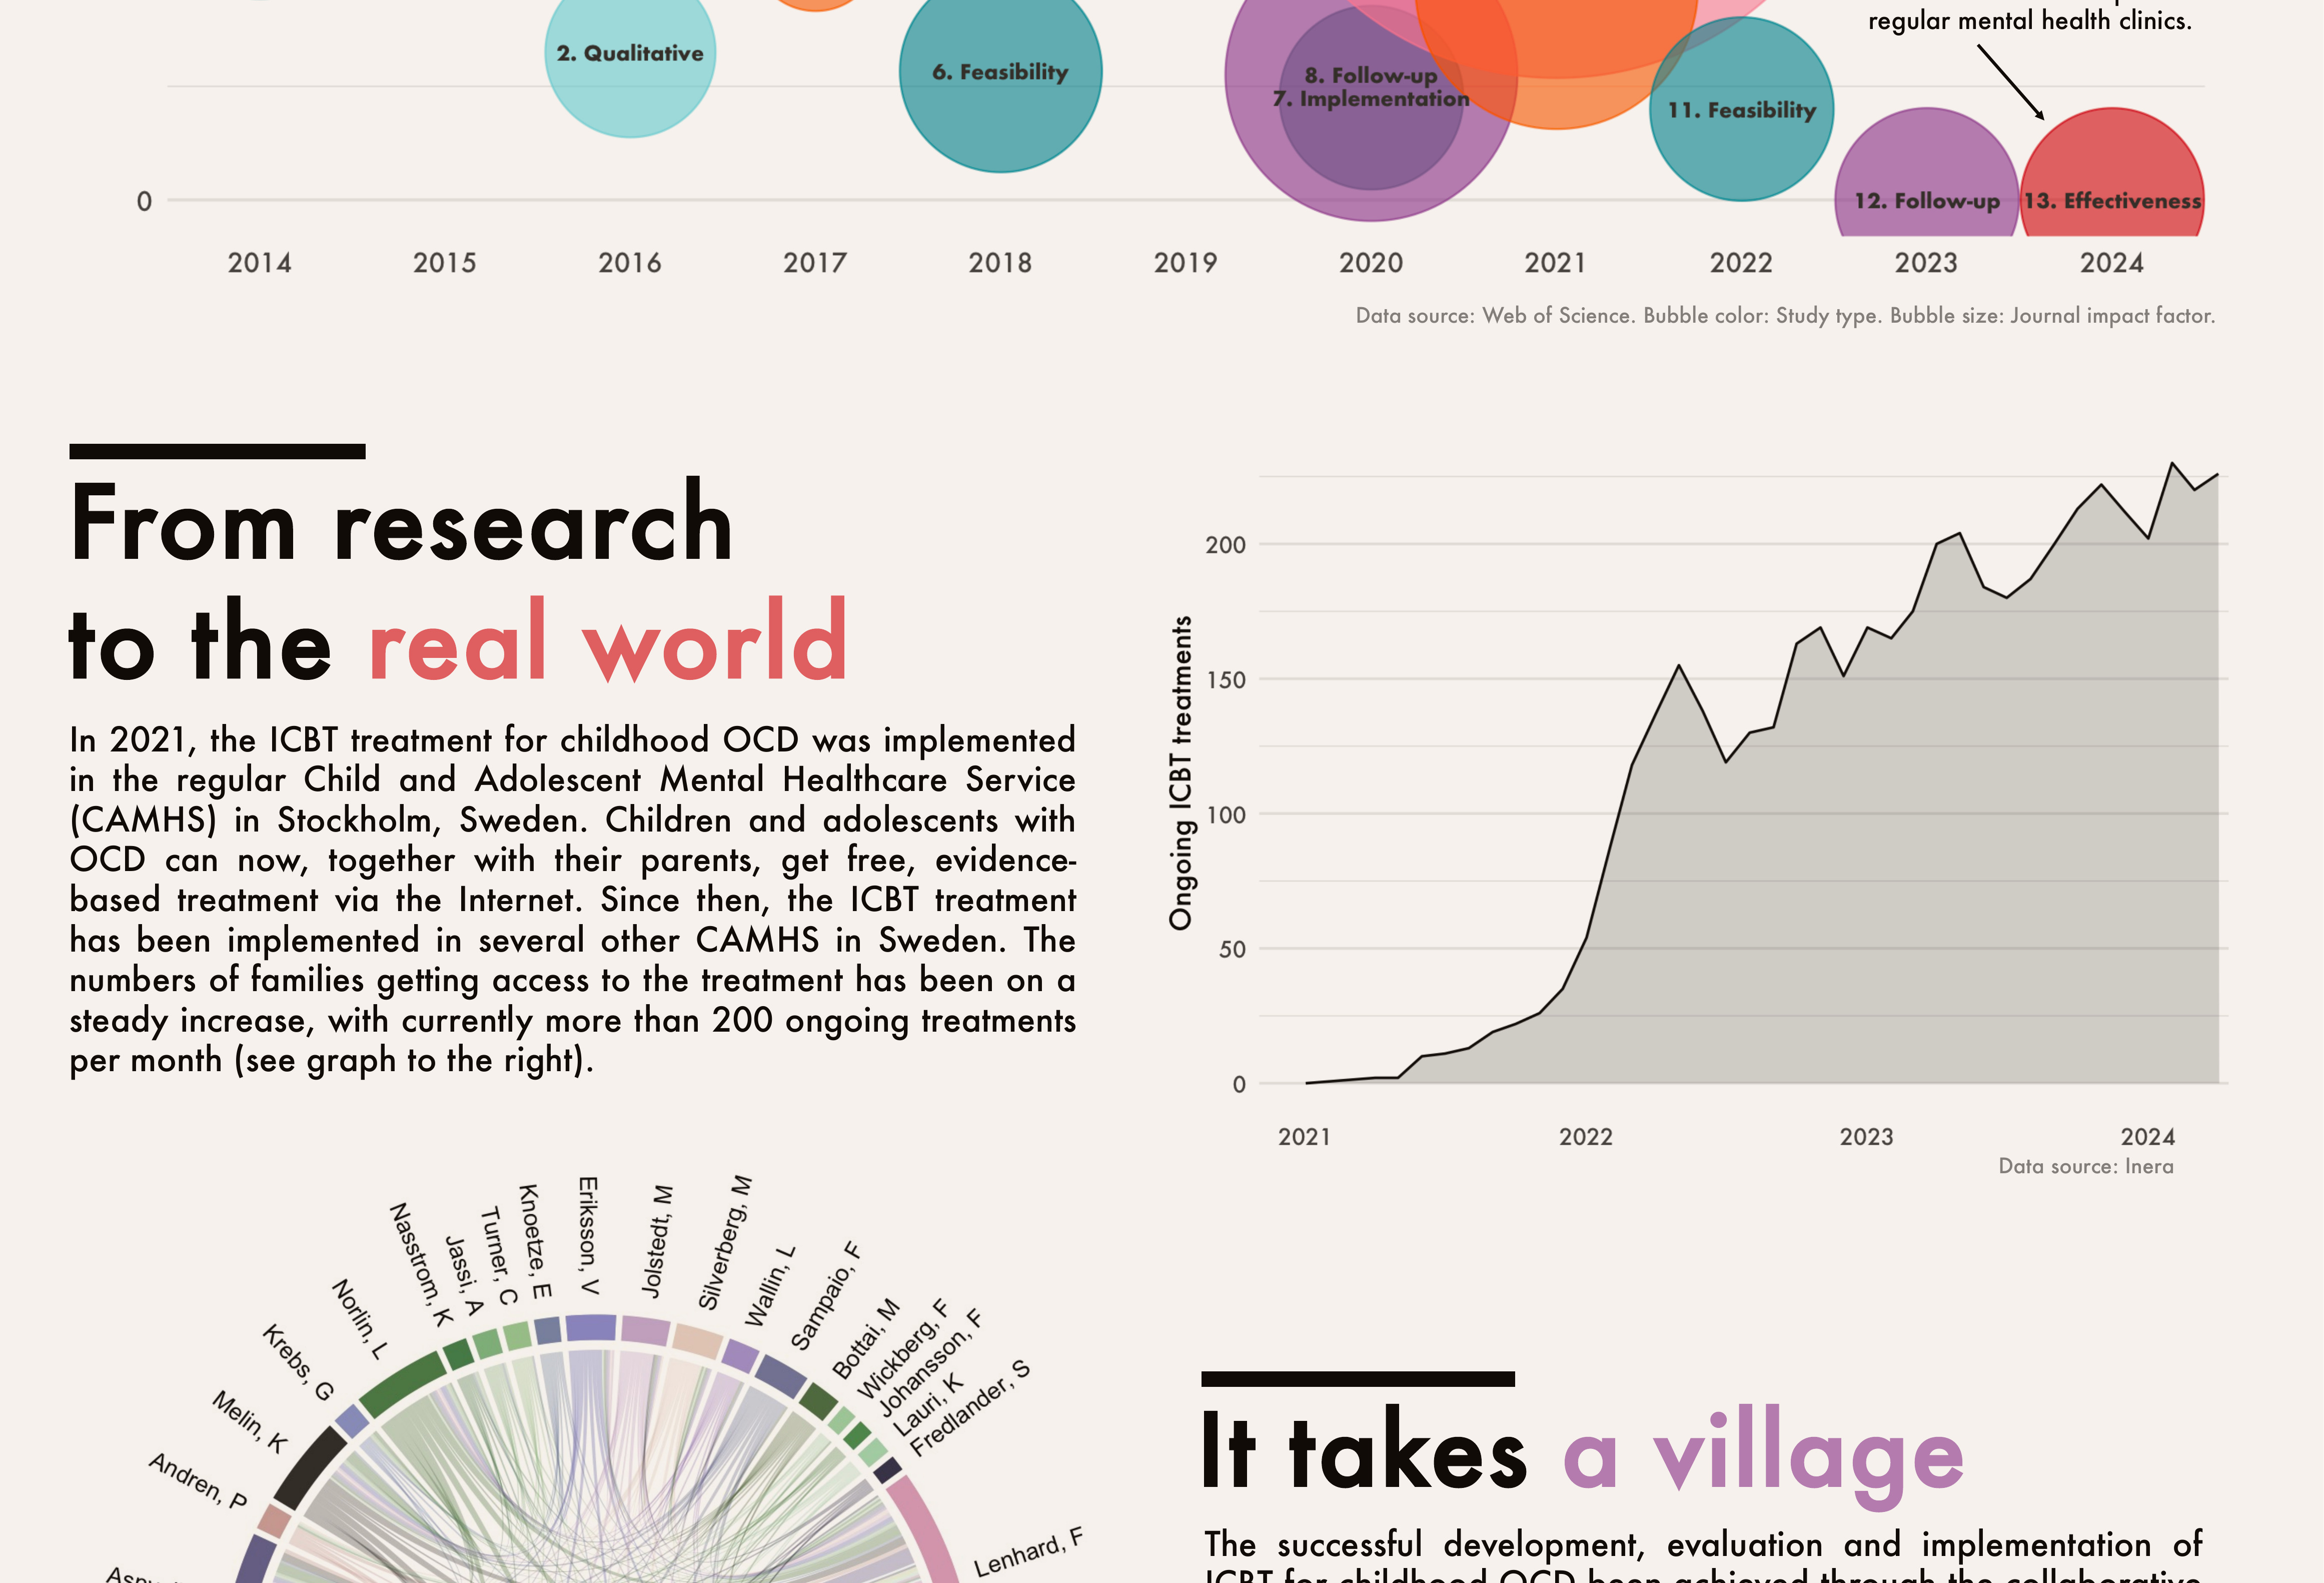
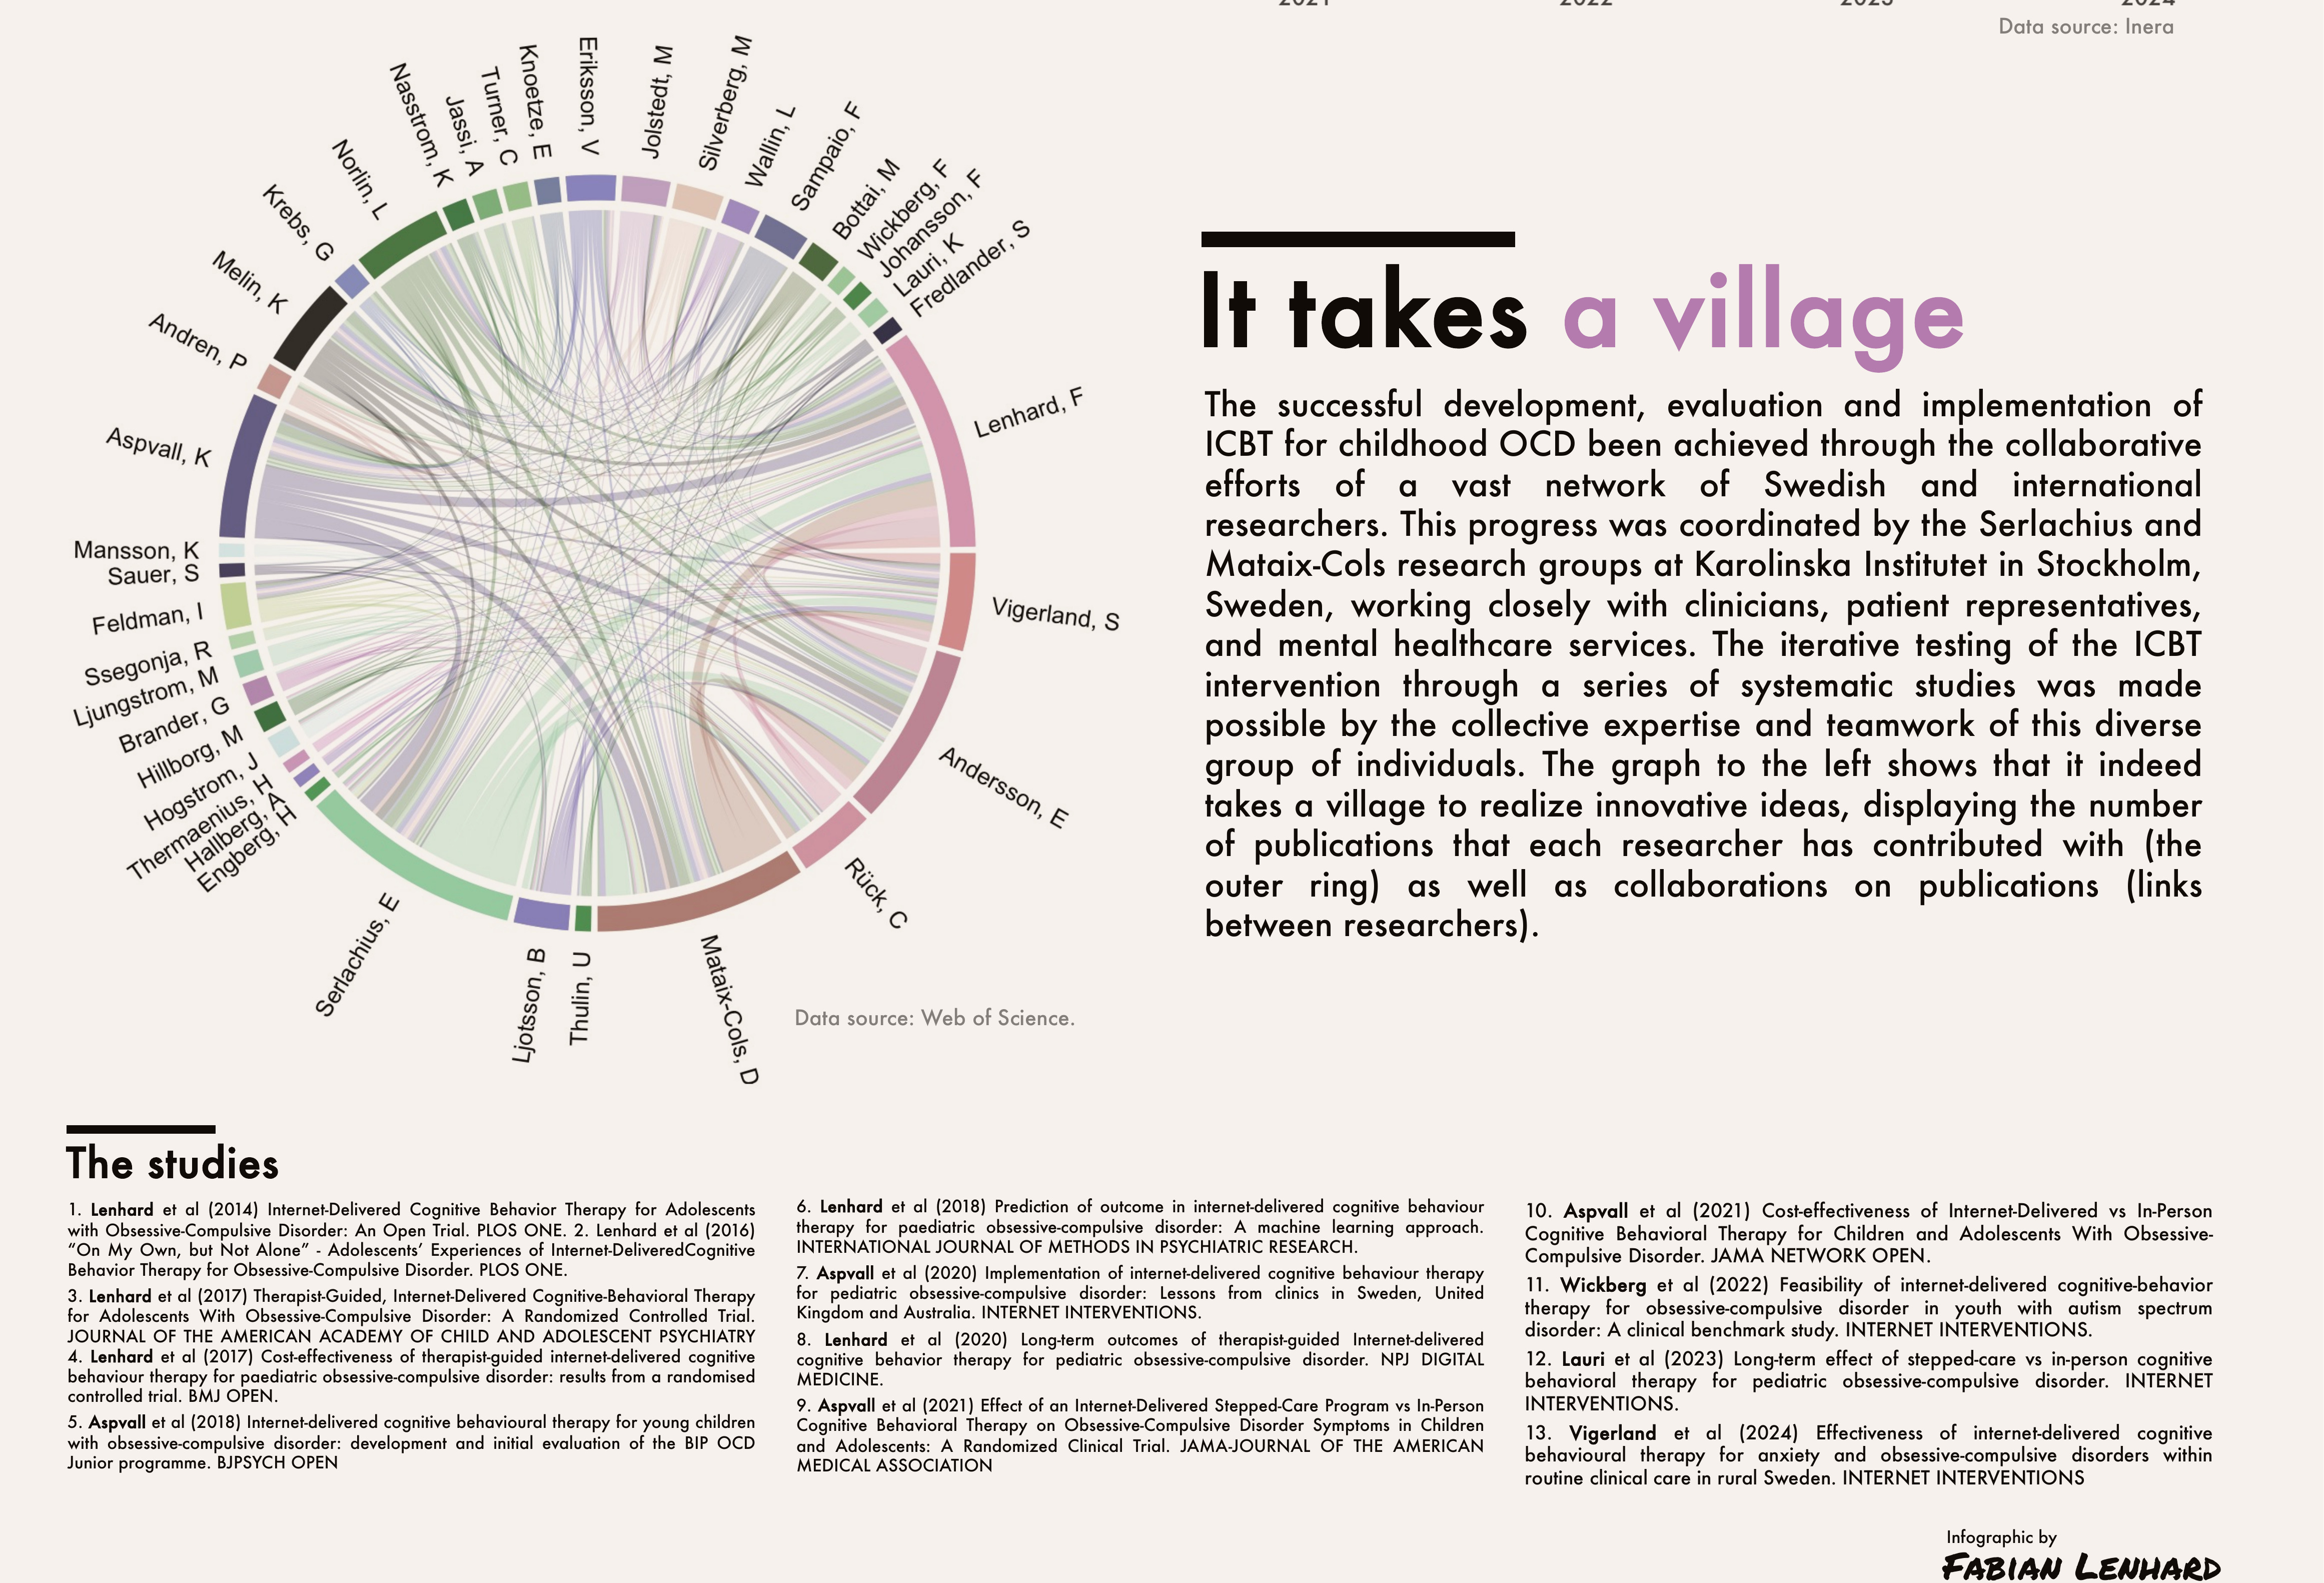
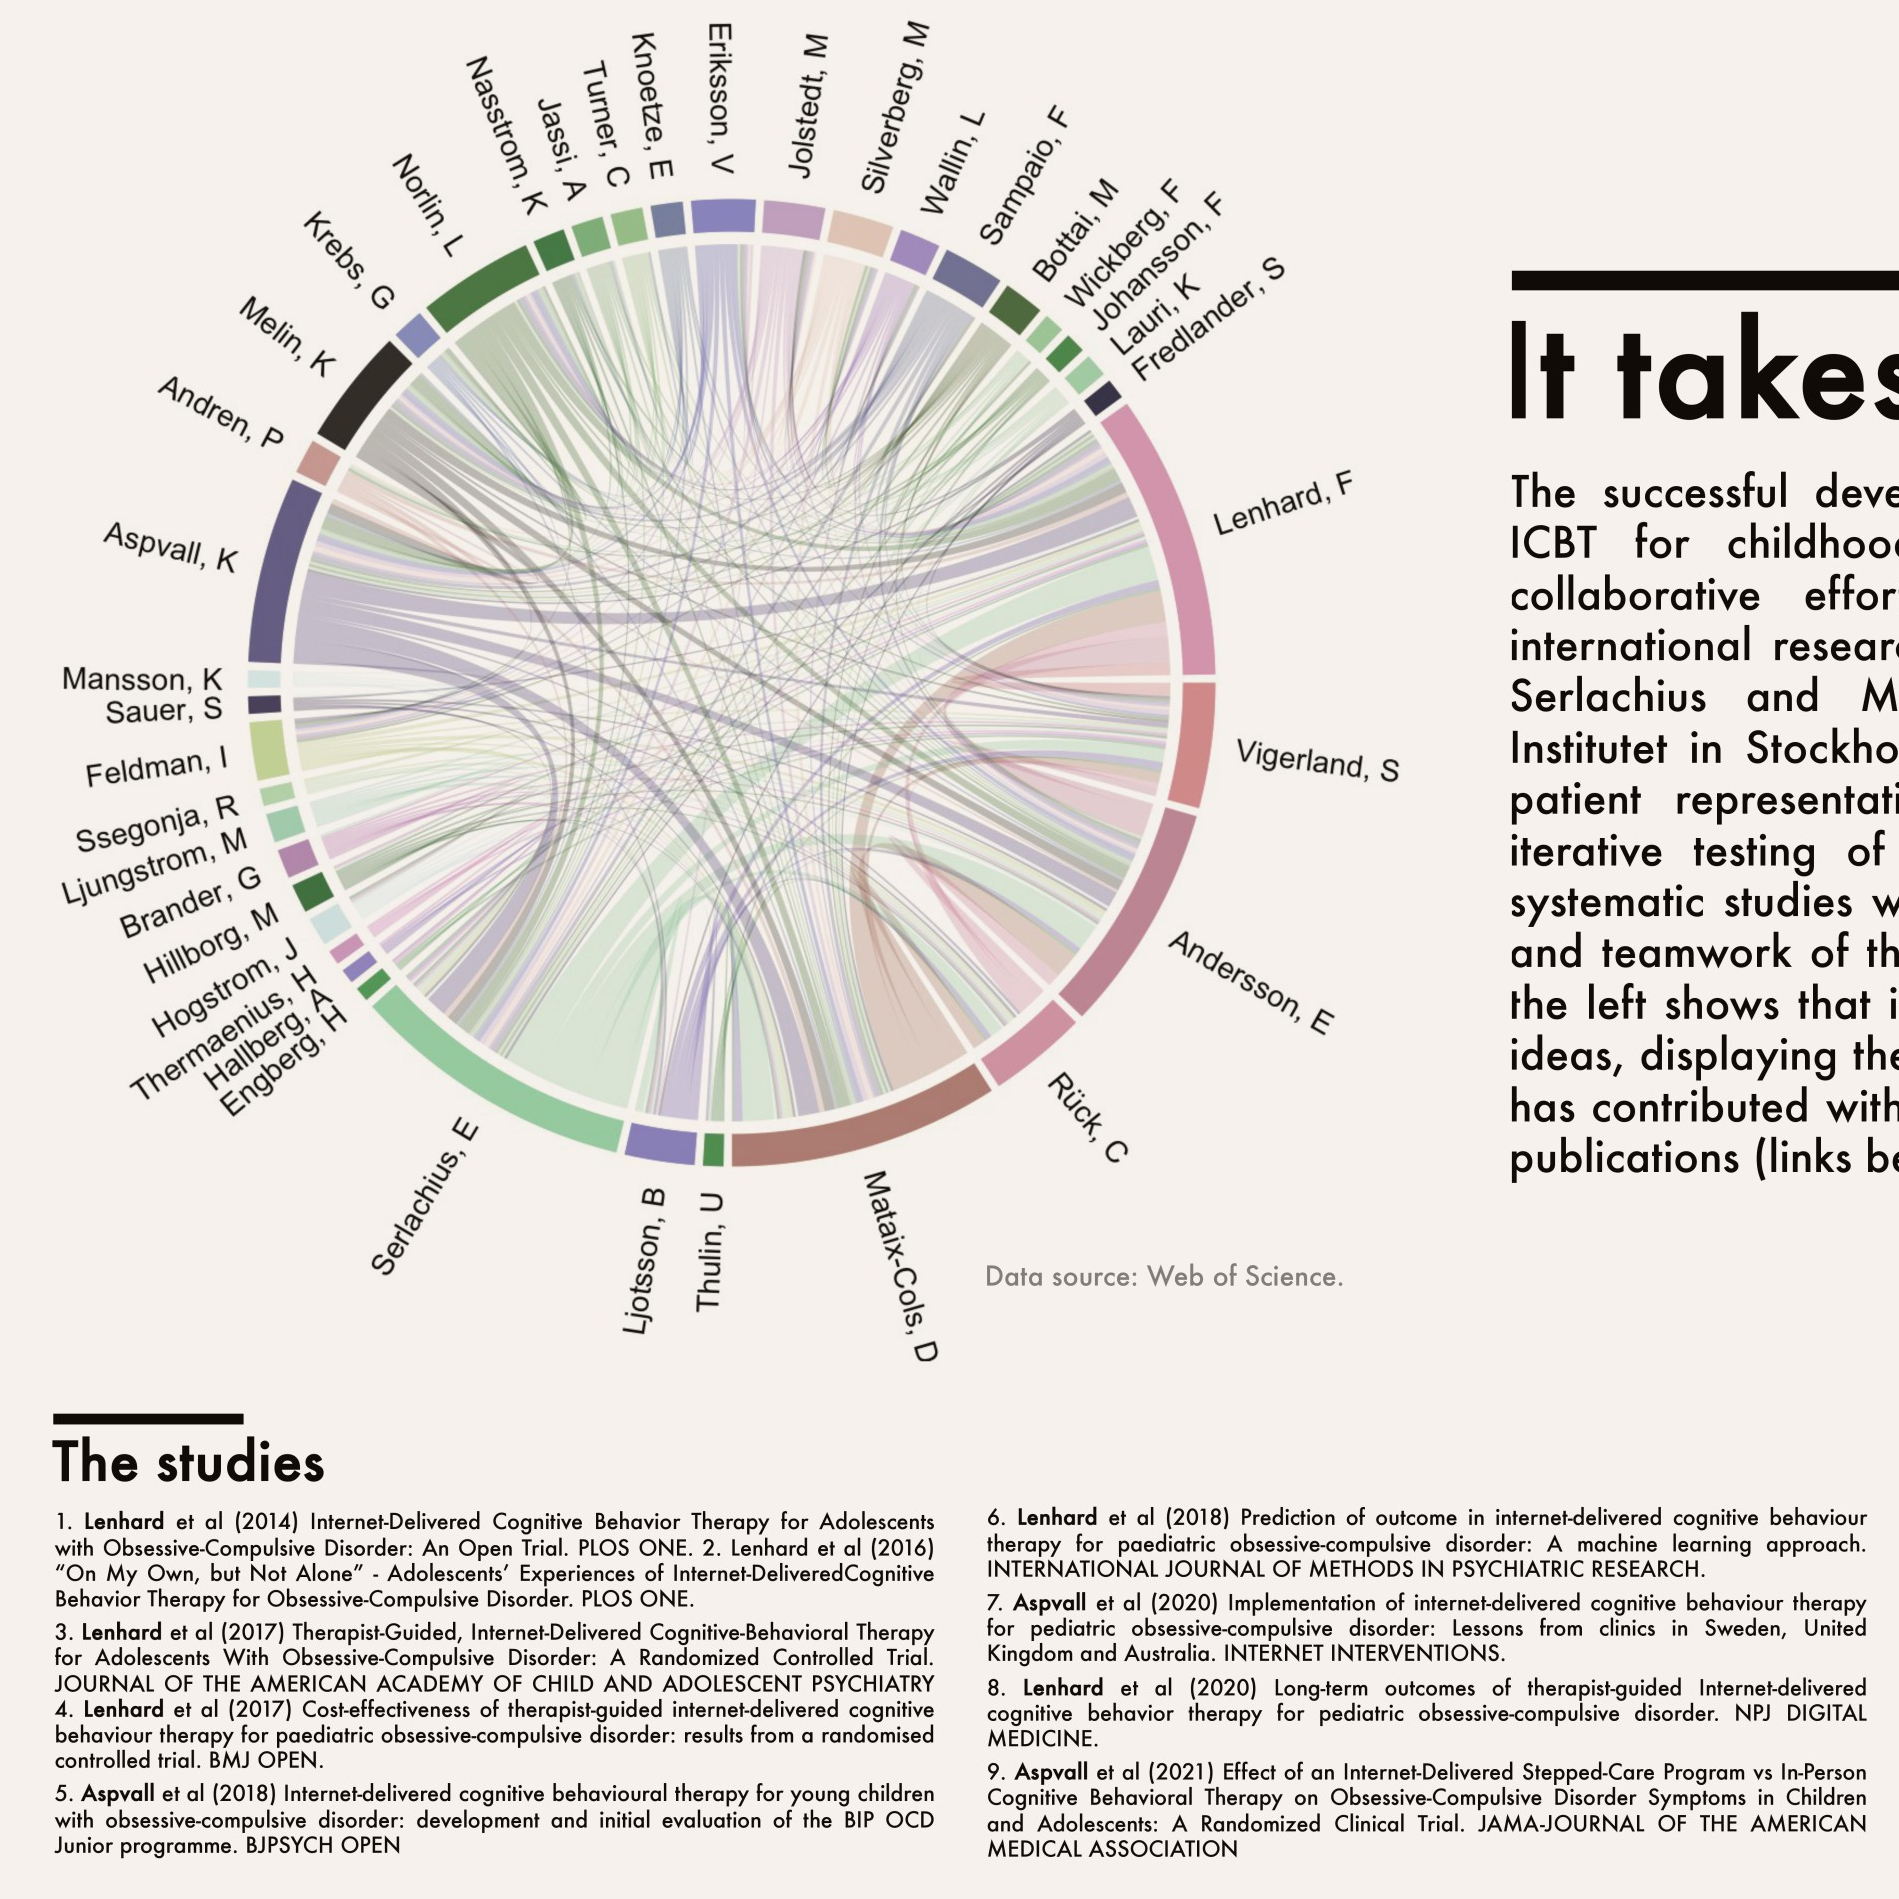
“A Decade of Progress”
In this project, I summarized the work my colleagues at Karolinska and I did on internet-delivered cognitive behavioral therapy (ICBT) for youth with OCD. The challenge was to simplify a large body of work, including complex research studies and their positive impact on affected youth and their families. I also aimed to show the teamwork involved and convey that it takes a diverse team to achieve something significant.

“The Effect of ICBT”
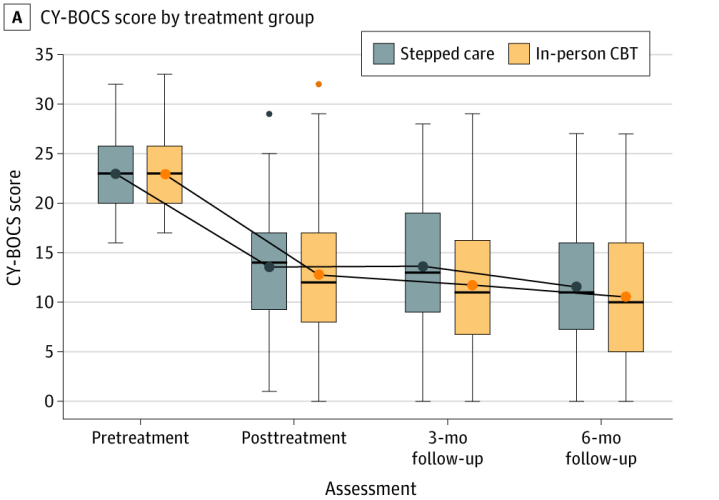
This is a somewhat more complicated statistical picture, but a good example of high information density. The graph shows treatment effect of ICBT compared to in-person CBT and comes from one of our studies that was published in JAMA. During the review process, JAMA asked us to make this relatively unusual graph.
It is a combination of a line graph and box plots that I had not seen before. If you are a data nerd, you know that a box plot gives you more information than the usual mean values and standard deviations. It looks simple, however, took some serious work to produce. It´s one of my personal favorites, as it contains lots of statisitical information, but still is relatively accessible.
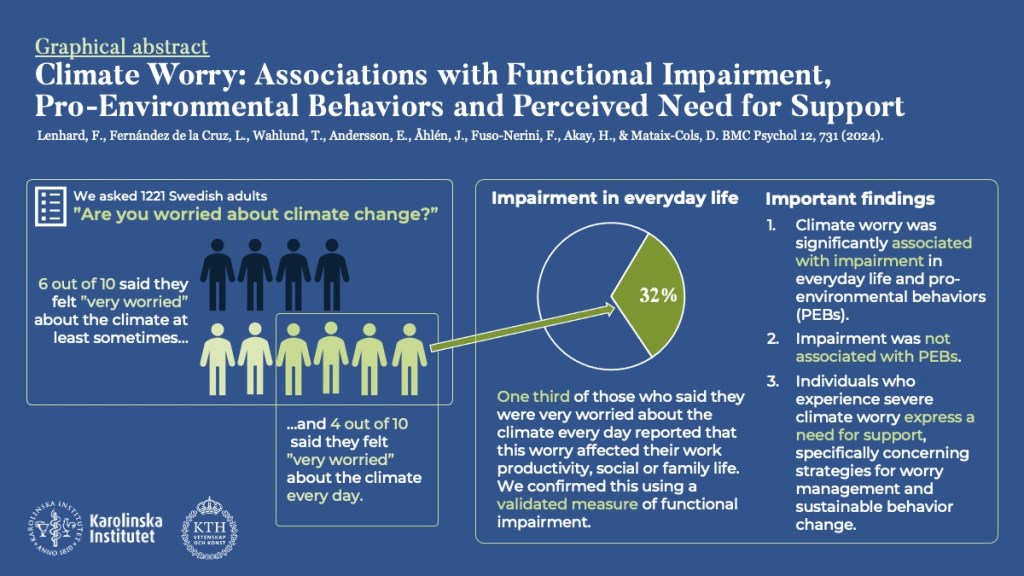
“Climate worry in Everyday Life”
This collaborative effort involved our team at Karolinska and the Climate Action Centre at KTH Royal Institute of Technology, with a focus on the impact of climate change concerns on the everyday life of adults in Sweden. In research, this is type of presentation referred to as a “graphical abstract”, which summarizes the findings of a research study in a single image. The use of graphical abstracts is increasingly prevalent, and it is my belief that this approach improves the accessibility of research for a broader audience. The original article is published at BMC Psychology.